Bar Chart Race Pro Usage Guide
“Bar Chart Race Pro” is a high-performance chart plugin that allows you to easily create animated graphs where rankings change in real-time.
By simply importing data from CSV files or Google Sheets, you can create visually impactful content and increase the time visitors spend on your site.
This guide explains everything from creating a new chart to data synchronization and design customization.
Creating a New Chart and Selecting a Data Source
First, create a new chart race and import the source data.

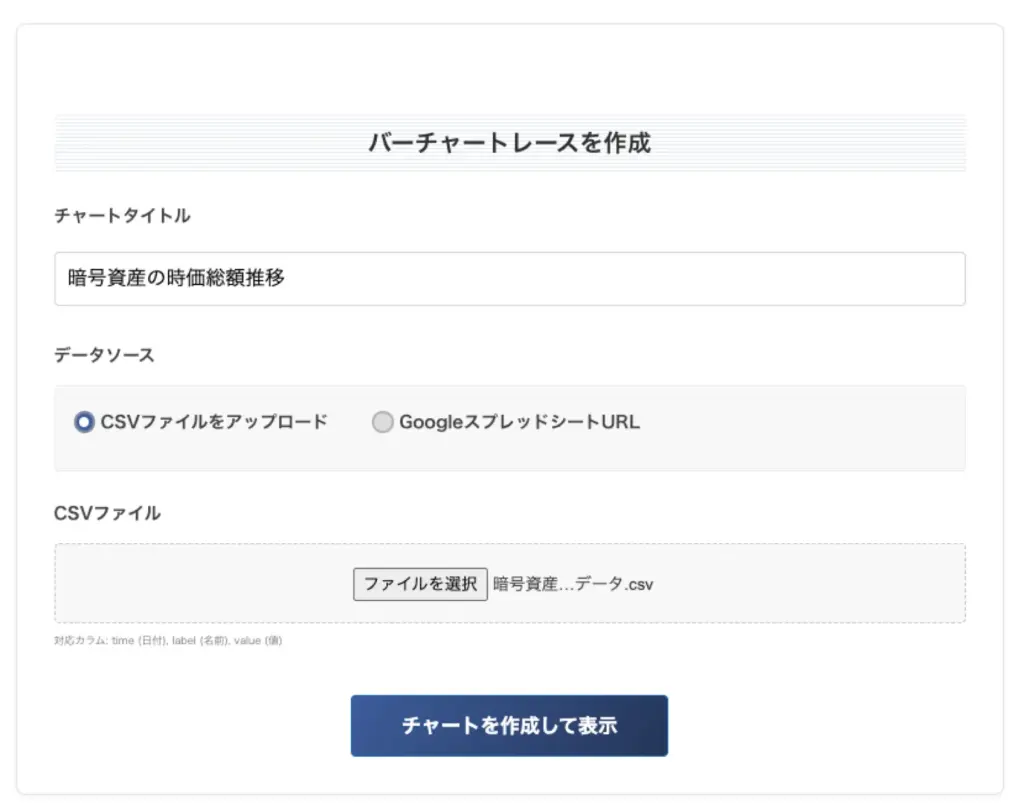
Chart Creation Steps
- Click on "Chart Race" in the left menu of the WordPress admin dashboard and select "Add New".
- Enter a name for the chart (e.g., Population Trends by Prefecture, Sales Ranking, etc.) in the "Chart Title" field.
- Select a "Data Source".
・Upload CSV File: When uploading a CSV file from your computer.
・Google Sheets URL: When linking with a Google Sheet. - Select the file or enter the URL and click the "Create Chart" button.
About Data Format
Data Editing and Preview
Once the data import is complete, you will be redirected to the editor screen.
Here, you can configure settings while checking the preview in real-time.
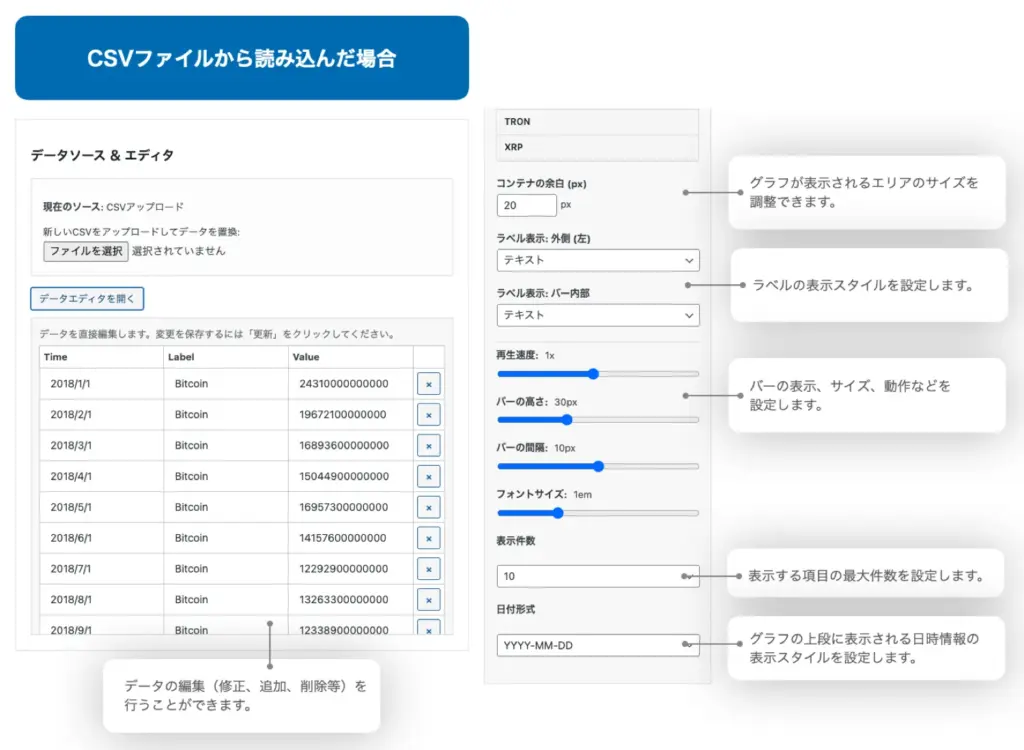
Simple Data Editor
Click the “Open Data Editor” button to display the imported data in a table format.
You can manually correct values or add/delete rows directly in the browser. After making corrections, be sure to click the “Update” button in the top right of the screen to save your changes.
Syncing with Google Sheets
If you are using a Google Sheet as your source, you can import the latest data into the chart simply by clicking the “Sync Now” button after updating the data on the sheet side.
Design and Display Settings
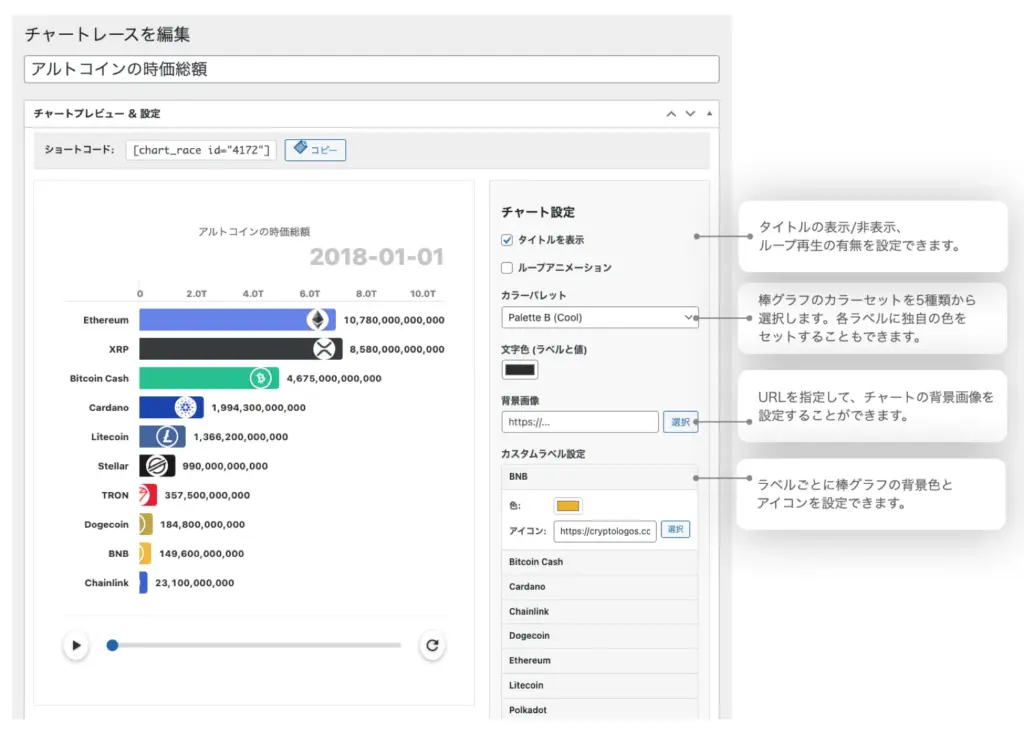
You can finely customize the appearance and movement of the chart. Changes to settings are immediately reflected in the preview.
Design & Color Settings
- Show Title: Set whether to display the title at the top of the chart.
- Animation Loop: Enable or disable automatic loop playback.
- Color Palette: Choose from 5 presets (Warm, Cool, Vivid, Monochrome, Metallic).
- Background Image: Set your favorite image as the background of the chart.
- Text Color: Specify the font color for labels and values.
- Custom Label Settings: Set background colors or icons for individual labels.
- Container Margin: Adjust the size of the area where the graph is displayed.
- Label Display: Choose the elements to display outside (left) or inside the bars from "Text", "Icon", or "None".
Basic Settings
- Playback Speed: Adjust the animation speed (0.1x to 5.0x).
- Bar Height / Bar Spacing: Adjust the thickness and interval of the bars in pixels.
- Font Size: Specify the text size for labels and values.
- Number of Items: Set the maximum number of bars to display in the ranking (e.g., Top 10).
- Date Format: Select the date display format (e.g., YYYY-MM-DD).
【Pro Feature】 Custom Label Settings (Color & Icon)
You can specify unique colors or icon images for specific items (bars).
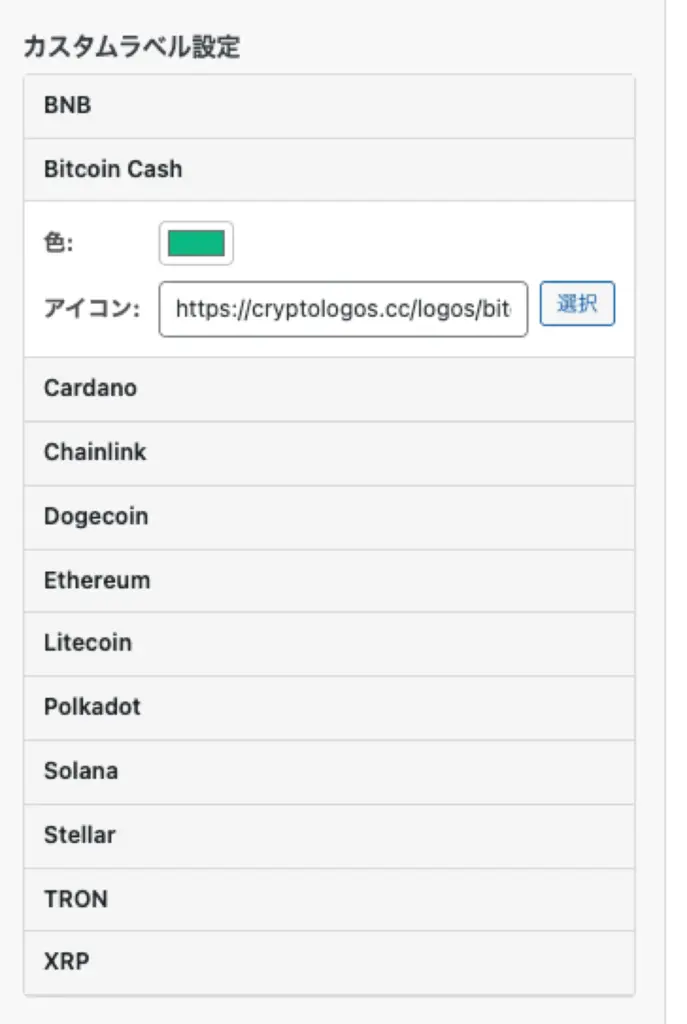
Configuration Steps
- Open the "Custom Label Settings" accordion in the settings area.
- A list of item names included in the data will be displayed.
- Click the item name you want to customize and configure the following:
・Color: Specify your preferred color using the color picker.
・Icon: Select an image from the media library or enter a URL via the "Select" button.
By setting corporate logos or national flags, you can create charts that are even more visually intuitive.
How to Display on Your Site
To display the created bar chart race on your site, use a shortcode.
Embedding Shortcodes
Copy the shortcode displayed at the top of the editor screen.
<code>[chart_race id="5"]</code>
Simply paste this code into the body of a fixed page or post (use the “Shortcode” block for the Block Editor) to display the animated graph.
Setting Up the User Submission Form
"Bar Chart Race Pro" also includes a feature that allows site visitors to upload CSV files and create their own charts.
| Shortcode | |
|---|---|
| Feature Overview | Placing this shortcode on a page displays a CSV upload form. When a user uploads a file, a bar chart race is automatically generated and played on the spot. Useful for internal tools or demonstration purposes. |
Precautions for Setting Up the User Submission Form
When setting up a submission form using the shortcode , please operate with caution after fully understanding the following risks and countermeasures.バーチャートレースを作成
Potential Risks
- Immediate Publication Specification: Charts submitted via this feature are immediately displayed on the site with a "Publish" status without requiring administrator approval.
- Submission of Inappropriate Content: There is a risk that malicious third parties may create and publish charts containing data that violates public order and morals or inappropriate labels.
- Spam and Load Attacks: If made public to an unspecified number of people, mass submissions by bots or other means may occur, potentially straining server resources.
Recommended Operation Methods
To minimize security risks, we strongly recommend using this feature in the following environments:
- Placement on Pages with Access Restrictions:
・Set the page visibility to "Password Protected".
・Use only within member-only sites or corporate intranets.
・Operate under a directory protected by Basic Authentication. - Guidance Only to Trusted Users:
・Do not make the form URL public; share it only with internal teams or specific clients.